
From Strategy to Execution: Where PnL Is Lost
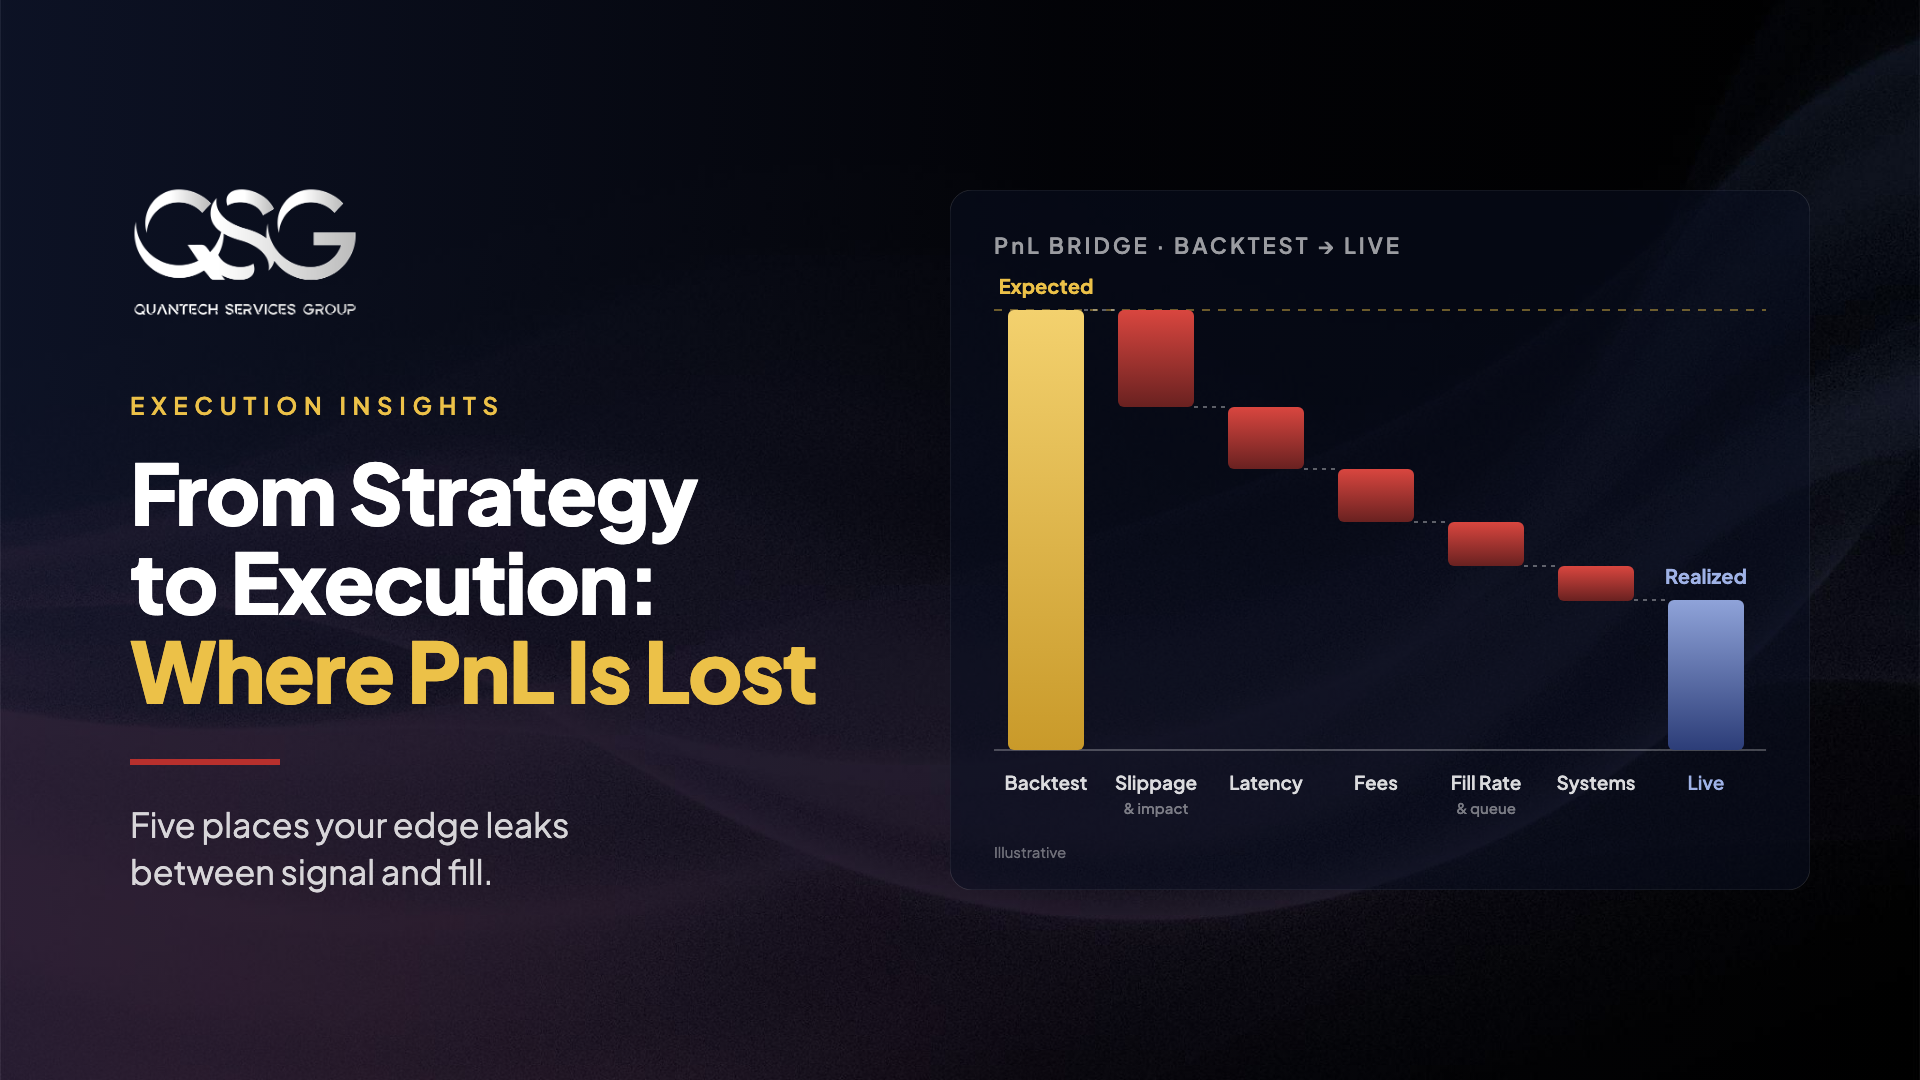
Every trading team has lived through this moment: the backtest curve is flawless, the Sharpe ratio in simulation is reassuring, yet once the strategy goes live, PnL falls visibly short of expectations. The strategy hasn’t changed, and the market hasn’t suddenly stopped working—so where did the profit go? The answer is almost always hiding in the same place: the execution path between signal generation and order fill. Every millisecond and every basis point along that path is real money leaking away.
Loss #1: Slippage and Market Impact
Fill prices in backtests are usually idealized: the mid price at the moment the signal fires, or the best bid/offer at that instant. In live trading, your order has to cross the spread and consume liquidity sitting on the book. For small orders, that may cost only half the spread; for large orders, the fill walks down the book level by level, and the average price ends up far worse than the top of book. More insidious is market impact—your own order moves the price, and that effect doesn’t dissipate until you’ve finished building the position. A strategy that earns 5 basis points per trade in backtest sees its profit cut in half if real execution costs 3 basis points; if the strategy’s edge is thinner still, execution costs alone can turn a positive-expectancy strategy into a machine that loses money reliably.
Loss #2: Latency
From market data arrival to signal computation, risk checks, order submission, and finally matching-engine confirmation, every segment adds latency. For strategies that depend on short-lived price dislocations, latency directly determines whether you capture the opportunity or the leftovers. When your system is one millisecond slower than the competition, the “fillable price” you see is already history; by the time your order reaches the matching engine, faster participants have swept the book. The cruelty of latency loss is its adverse-selection nature: slow orders only get filled when nobody wants them, and the prices you actually want are never yours to take. This is also why latency cannot be measured by averages alone—tail latency (p99, p99.9) is what determines how bad the bad days get.
Loss #3: Fees and Rate Structures
Fees are the most underestimated cost, because backtests routinely reduce them to a single fixed number. In reality, the gap between taker and maker rates, fee tiers across account levels, and perpetual funding rates all vary dynamically with how the strategy trades and which side it holds. A strategy that frequently carries positions across funding intervals can watch funding quietly consume most of its gross profit; a strategy forced to fill as a taker, in a market where spreads are already tight, may find fees alone exceeding the expected gain per trade. Fee structure is not a footnote to execution—it is a precondition for whether the strategy is viable at all.
Loss #4: Fill Rates and Queue Position
Quoting as a maker saves fees and earns the spread, but the price is uncertainty of execution. Your limit order’s position in the queue determines its probability of filling, and the fills themselves carry adverse selection: when price moves in your favor, the order doesn’t fill; when it moves against you, you’re the first to get hit. A backtest that assumes limit orders always fill is manufacturing profit that doesn’t exist. Fill rates, queue models, and the timing of cancels and amends—details routinely ignored at the research stage—are precisely what decide whether a maker strategy lives or dies in production.
Loss #5: Imperfect Systems
API timeouts, delayed or missing order-status updates, position mismatches after partial fills, exchange-side rate limits and rejections—these engineering-level failures never appear in any backtest, yet each one creates unintended risk exposure. When a system cannot determine its true position during an anomaly, every subsequent decision is built on a false premise. The robustness of an execution system is not a nice-to-have; it is a direct component of PnL: a single runaway position drift can erase weeks of accumulated profit.
Managing Execution as Alpha
The remedy is not any single technique but a discipline: measure execution with the same rigor you apply to research. Build a complete transaction cost analysis—compare every fill against the benchmark price at decision time and compute implementation shortfall; use markout analysis to track post-fill price drift and quantify the degree of adverse selection; turn latency, fill rates, and rejection rates into continuously monitored metrics rather than post-mortem material. Only when this data is made transparent can a team answer the questions that actually matter: How much of the strategy’s theoretical edge truly lands in the account? Which stage concentrates the losses? Is the marginal return on improving execution higher than that of developing the next strategy?
Many teams treat research and execution as two separate worlds—the former a stage for the brilliant, the latter chores for engineers. That division of labor is itself a root cause of PnL leakage. In fiercely competitive markets, theoretical strategy edges keep getting thinner, and execution quality becomes the decisive dividing line. Hand the same signal to two teams with different execution capabilities, and one may profit steadily while the other bleeds.
The distance from strategy to execution is the distance between theory and reality. Profit is not created in ideas—it is realized in every fill, and lost in every fill as well.
FAQ
1. What is slippage?
Slippage is the difference between the price at which your order actually fills and the price you saw at the moment of decision. Between signal trigger and the order’s arrival at the exchange’s matching engine, the price may have already moved; meanwhile, a market order must cross the bid-ask spread and consume liquidity on the book, and large orders walk down the book level by level. Together, these factors make real fill prices worse than the idealized assumptions used in backtests.
2. What is market impact?
Market impact is the effect your own order has on the price. As your order consumes liquidity from the order book, the price moves against you, and that effect does not dissipate until the position is fully built. The larger the order and the thinner the market depth, the more pronounced the impact—this is the main reason executing large orders costs far more than small ones.
3. What is latency, and why does it erode profit?
Latency is the time accumulated from market data arrival through signal computation, risk checks, and order submission, to matching-engine confirmation. For strategies that depend on short-lived price dislocations, latency determines whether you capture the opportunity or the leftovers: if you are slower than the competition, the “fillable price” you see is already history. Latency loss carries an adverse-selection property—slow orders only fill at prices nobody else wants—which is why latency cannot be judged by averages alone; tail latency (p99, p99.9) is what matters.
4. What is adverse selection?
Adverse selection means your fills are systematically concentrated in situations that are unfavorable to you. Take limit orders: when price moves in your favor, the order doesn’t fill; when it moves against you, your order is the first to get hit. Latency produces the same effect—slow orders only pick up prices others have rejected. Adverse selection turns apparent “cost savings” into an illusion, making it the most insidious form of execution loss.
5. Why does live performance fall short of backtest performance?
Common causes include: backtests using idealized fill prices (mid price or best bid/offer) while ignoring spread and slippage; assuming limit orders always fill while ignoring queue position and fill rates; reducing fees to a fixed number while ignoring taker/maker rate differences and funding rates; and entirely omitting system-level anomalies such as API timeouts, partial fills, and rate-limit rejections. Every gap between assumption and reality is a source of live PnL leakage.
6. What is implementation shortfall?
Implementation shortfall is the core metric of execution quality, defined as the difference between the actual fill price and the benchmark price at decision time. It consolidates slippage, market impact, latency, and timing costs into a single number. Computed trade by trade, it quantifies how much of a strategy’s theoretical edge is consumed in execution, and it forms the foundation of transaction cost analysis (TCA).
7. What is markout analysis?
Markout analysis examines how the price moves relative to your fill price over a window after execution (e.g., 1 second, 10 seconds, 1 minute). If price systematically moves against you after your fills, your executions carry significant adverse selection; if not, execution quality is sound. Markout is the most direct tool for quantifying adverse selection and is widely used to evaluate the true performance of maker strategies and execution algorithms.
8. How can the PnL loss between strategy and execution be reduced?
The key is not any single technique but a discipline: measure execution with the same rigor applied to research. Build a complete transaction cost analysis and compute implementation shortfall trade by trade; use markout to quantify adverse selection; turn latency, fill rates, and rejection rates into continuously monitored metrics. Only once this data is transparent can you determine where losses concentrate—and whether the marginal return on improving execution exceeds that of developing the next strategy.